
Introduction
Imagine you’re trying to predict the future, but instead of a crystal ball, you have a couple of super-smart tools in your trading toolkit: RSI and MACD. These indicators, although sounding like high-tech gadgets, are actually pretty straightforward once you get to know them. Let’s break down how you can use them to boost your trading game, with some real-life examples and a bit of humor along the way.
But first, let’s set the scene. The stock market can often feel like a roller coaster—full of unexpected drops and exhilarating climbs. It’s no wonder that so many traders seek reliable tools to help them navigate this unpredictable terrain. That’s where RSI and MACD come into play. These indicators offer a way to read the market’s mood, helping you make more informed decisions rather than just guessing which way the ride will go next.
Understanding how RSI and MACD work can be the difference between feeling like you’re blindly tossing a coin and actually having a strategy that increases your chances of success. So, whether you’re a newbie or a seasoned trader, this guide will give you the knowledge you need to harness these powerful tools effectively.
What Are RSI and MACD?
In the world of trading, RSI (Relative Strength Index) and MACD (Moving Average Convergence Divergence) are like your trusted sidekicks. RSI tells you when a stock is too hot to handle (overbought) or when it’s cold enough to buy (oversold). Developed by J. Welles Wilder Jr. in 1978, RSI gives you a score from 0 to 100, where above 70 means “Whoa, slow down!” and below 30 means “Hey, this could be a deal!”
RSI is essentially your market’s speedometer. Imagine driving a car—when you hit the gas too hard, you’re bound to run into trouble, like getting pulled over or crashing. The same goes for the market; if a stock’s price accelerates too quickly, RSI will show an overbought condition, suggesting that the price may soon hit a speed bump. On the flip side, if the price drops too fast, RSI indicates an oversold condition, which could mean it’s time to put the pedal to the metal and buy.
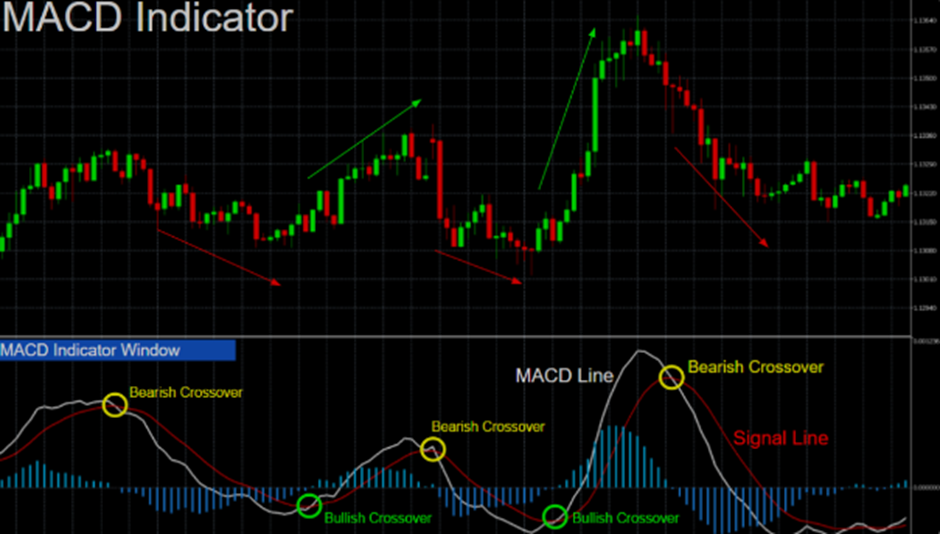
MACD, on the other hand, is like your market’s GPS. Created by Gerald Appel in the late ’70s, MACD helps you see the bigger picture by showing you where the market is heading. It compares two moving averages and plots them on a chart, giving you signals like “Take this exit” or “Stay on course.” This way, you’re not just driving in circles; you have a clear path forward, whether that means buying or selling at the right time.
RSI and MACD together can be likened to the perfect road trip team—one keeps an eye on the speed, and the other navigates the journey. When used correctly, they can help you reach your destination (profit) with fewer detours and breakdowns along the way.
Using RSI and MACD Together
These two indicators are like peanut butter and jelly—great on their own, but even better together. When RSI says a stock is oversold and MACD confirms with a bullish signal, it’s like the universe giving you a thumbs-up. This combo can help you find those sweet trading opportunities where profits might be just around the corner.
Let’s break it down a bit more. When you see RSI dipping below 30, it’s waving a flag saying, “Hey, this stock might be undervalued!” But hold your horses—it’s not time to buy just yet. You’ll want to check in with MACD to see if it agrees. If MACD shows a bullish crossover at the same time, you’ve got a stronger case to jump in. It’s like getting a second opinion from your financial doctor before making a big decision.
The real magic happens when these indicators align. It’s like when the stars line up perfectly for a once-in-a-lifetime cosmic event. These moments don’t happen often, but when they do, traders who are paying attention can capitalize on significant gains. By waiting for both RSI and MACD to give you the green light, you can reduce the risk of false signals and increase your chances of making profitable trades.
Examples of Using RSI and MACD in Trading
Take the wild ride of Bitcoin in early 2021. When Bitcoin’s RSI dipped below 30 during a correction, some savvy traders saw it as a “buy now” signal. At the same time, MACD was like, “Yep, it’s about to bounce back!” Those who listened to these signals rode the wave to impressive gains as Bitcoin surged again.
Here’s another example from the stock market. Back in 2018, Apple’s stock experienced a sharp decline, causing its RSI to fall below 30. While some traders panicked and sold, those who combined this information with a bullish MACD crossover saw an opportunity. As it turns out, Apple rebounded, and those who held their positions or bought more shares reaped the rewards. It’s a classic case of using RSI and MACD together to spot a diamond in the rough.
The beauty of these indicators is that they’re not just for the big players like Bitcoin and Apple. They can be applied to all sorts of assets, from lesser-known stocks to forex pairs. For instance, in the forex market, let’s say the EUR/USD pair’s RSI drops below 30. If MACD also signals a bullish trend, you’ve got yourself a potential winning trade. By using RSI and MACD across different markets, you can find opportunities that others might miss.
Using RSI and MACD in Different Markets
Whether you’re trading stocks, forex, or cryptocurrencies, RSI and MACD can be your go-to guides. In the stock market, if RSI hits above 70, it might be time to cash in, especially if MACD shows a bearish crossover. In the forex world, if EUR/USD’s RSI drops below 30, it could be a good time to buy, with MACD giving you the all-clear. And in the wild west of cryptocurrencies, these indicators are lifesavers, especially when the market’s swinging like a pendulum. For more insights, check out https://neoprofit.pro/.
Let’s start with stocks. Suppose you’ve been watching a particular stock climb steadily over several months. Suddenly, the RSI crosses above 70, signaling that the stock might be overbought. You could take this as a cue to sell, especially if MACD is also hinting that the upward trend is losing steam. This kind of coordinated signal can help you lock in profits before the market corrects itself.
In the forex market, things move fast, and small price changes can have big consequences. Say you’re trading the EUR/USD pair, and its RSI drops below 30. While this suggests the euro might be undervalued, it’s wise to wait for MACD to confirm a trend reversal before making a move. When both indicators align, it’s like getting a green light to go ahead and place your trade with greater confidence.
Conclusion
RSI and MACD aren’t just for the pros—they’re tools anyone can use to make smarter trades. By combining their powers and learning to read the signals, you’ll be better equipped to navigate the ups and downs of the market. Remember, trading is as much about strategy as it is about timing, and with RSI and MACD, you’ll be well on your way to making more informed decisions.
However, don’t just take these tools at face value. Like any good strategy, it’s important to understand the context in which you’re using them. What works in one market might not work as well in another, so always be adaptable. If you’re trading stocks, for example, make sure you’re also keeping an eye on broader economic indicators. For forex, consider geopolitical factors. And in crypto, be aware of the latest news that could impact prices overnight.